Author: Azure
Compile: value
Source: GPLP

The Performance Growth is Synchronized with the Debt Level of Gang Long Group.
Following the invalidation of the first prospectus on April 22, Gang Long Group Co., Ltd. (hereinafter referred to as “Gang Long Group”) submitted the prospectus to the Hong Kong Exchanges and Clearing Limited (HKEX) on May 12.
Gang Long Group is a real estate developer based in the Yangtze River Delta and headquartered in Shanghai. Its estates management projects are mostly located in Jiang Su and Zhe Jiang provinces. Based on the contracted floor areas that have been sold in 2019, Gang Long Group ranks 83rd among the real estate developers in China.
Up to the valuation date, Gang Long Group has 53 development projects in 22 cities with a total land reserve of 5,444,400 square meters, including 260,800 square meters of completed projects, 4,751,700 square meters of ongoing projects, and 431,900 square meters of future development properties.
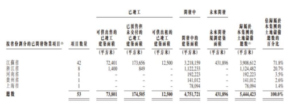
Gang Long Group’s revenue only came from nine development projects in four cities during the track record period, because there are a large number of projects under development and for future development.
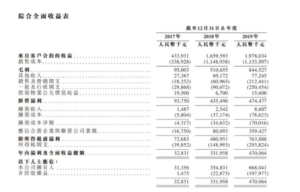
From 2017 to 2019, the real estate development and sales revenue of Gang Long Group were 434 million yuan, 1.66 billion yuan, and 1.978 billion yuan, with a compound annual growth rate of 113.5%. The net profit was 33 million yuan, 332 million yuan and 470 million yaun respectively, with a compound annual growth rate of 278.6%, and the net profit increased by 13 times in the three years.
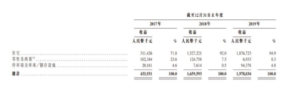
Gang Long Group mainly relies on the sales of residential property. From 2017 to 2019, the sales revenue of residential property of Gang Long Group is 311 million, 1.527 billion and 1.877 billion respectively, accounting for 71.8%, 92.0% and 94.9% of the total revenue, showing a growing trend year by year.
Gang Long Group’s residential property gross profit rate growth is very fast in recent three years.
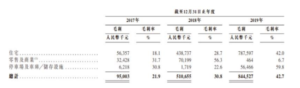
According to the prospectus, from 2017 to 2019, Gang Long Group’s gross profit rate of residential properties was 18.1 percent, 28.7 percent and 42.0 percent. In the past three years, the gross profit increased by 23.9 percent and the comprehensive gross profit increased by 20.8 percent.
The performance growth is synchronized with the debt level of Gang Long Group
Although both revenue and net profit have increased, the operation cash outflow of Gang Long Group is quite astonishing. From 2017 to 2019, the net cash income from operating activities is 76 million, -626 million and -6.756 billion. Under the circumstances of negative operating cash flow, Gang Long Group’s financing needs are further expanded.
From 2017 to 2019, the total liabilities of Gang Long Group are 4.945 billion, 8.74 billion and 21.139 billion, with a year-on-year growth rate of 141.86% in 2019. The liabilities mainly consist of current liabilities. In the three years, the current liabilities of Gang Long Group are 4.770 billion, 8.123 billion and 19.432 billion.
From 2017 to 2019, Gang Long Group asset-liability ratio rose rapidly, at 98.8%, 122.1%, and 172.6%, respectively. Until March 31, 2020, Gang Long Group asset-liability ratio has reached 287.0%, far exceeding the average Level. According to public information, the average asset-liability ratio of China’s top 100 housing companies in 2019 is 78.7%.